
Does Code Coverage Guarantee Quality?
Is Code Coverage a useful metric? Is it worth chasing 100% coverage? Does high code coverage guarantee quality? In this article I explore these and other questions.
Code coverage is the percentage of code covered by automated tests. The metric is measured over all the code that gets executed when the tests run. It can give us powerful feedback, but it also has its weaknesses.
In this article, we’ll explore several aspects of Code Coverage, see how best to apply it to get good results, and also look a bit at complementary metrics that help us trust the numbers we get.
How is the Code Coverage metric calculated?
Most modern coverage analysis tools rely on code instrumentation. That is, they analyze the code’s structures (classes, methods, statements, branches).
There are three kinds of coverage analysis these tools usually perform:
| Type | Description |
|---|---|
| Statements | Statement coverage measures whether each Statement was executed during the tests. |
| Branches | Branch coverage measures whether the possible branches in control flow structures were taken. For example, whether each if/else, each ternary, and each switch/case option was entered. |
| Methods | Method coverage measures whether a method was executed at all during the tests. |
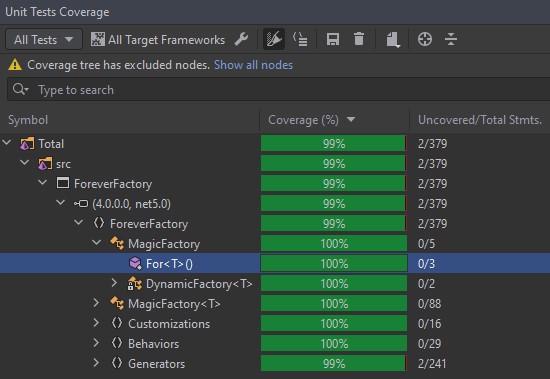
When a code coverage tool runs, it performs these three analyses and uses them to produce a composite metric, the Total Coverage Percentage. That’s the number the tools display.
Nota
Some tools, like Cobertura or Emma, produce a metric called Line Coverage. It’s a very simple metric that measures the number of lines of code covered by the tests. It’s offered by tools that do bytecode instrumentation. Since they only have access to the compiled classes, all they can see is the line number. The Statement Coverage metric is very similar, but with the advantage of carrying more useful information.
When is Code Coverage useful?
Code Coverage is an important metric as part of a feedback loop in the software development process. Coverage reports are essential for understanding which parts of a piece of software are better covered by tests and which are more vulnerable. So we can conclude that it’s always useful to track this metric.
How useful the metric and the coverage reports are will depend on our ability to use that information to support decision-making in the project, and it can vary with each project’s context.
For example, a team that’s starting to adopt automated tests in a legacy project can use this metric to track the progress of its testing efforts, aiming at first for a moderate coverage percentage and focusing more on covering specific critical routines.
A team that’s mature in writing automated tests and keeps a reasonably high coverage percentage in its project, on the other hand, can use it to make sure the test suite keeps testing the application well as it evolves.
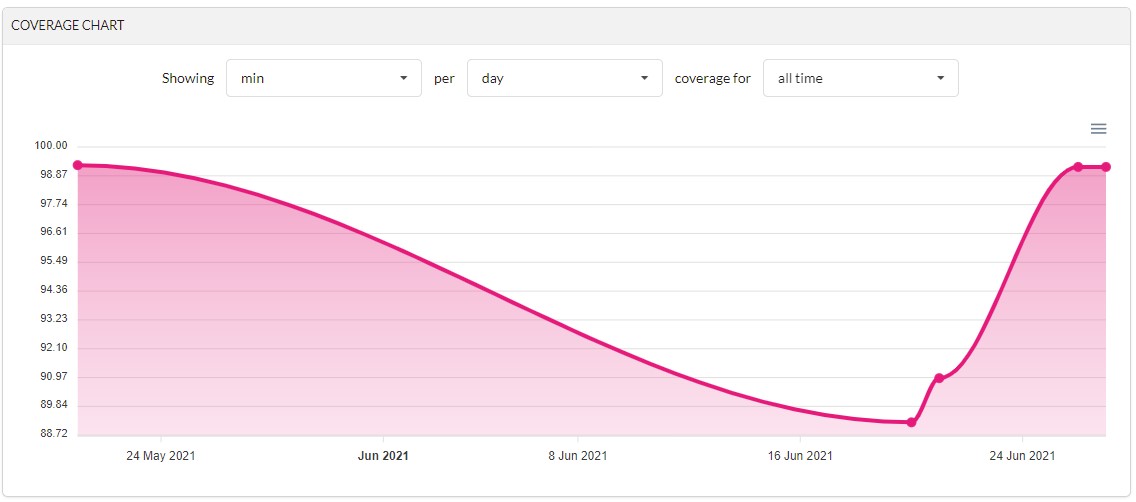
Coverage analysis should run along with the tests, automatically, in the project’s CI pipeline. That way we get fast feedback on how the tests and the project are evolving. If the coverage percentage drops below a predetermined number, we can even make the build fail, requiring the team to write more tests.
When does it make sense to aim for 100% coverage?
Code coverage tends to follow the 80-20 rule: the closer we get to 100%, the harder it becomes to increase coverage. That’s because a few basic tests can often cover most of the flow. But to push coverage further, you need increasingly specific tests to handle small alternative scenarios.
Open-source projects usually aim for 100% coverage or something very close to it. This matters because dozens or even thousands of other applications may depend on that project. So this is a situation where aiming for very high coverage numbers makes a lot of sense.
For closed-source commercial projects, I believe that, apart from rare high-criticality exceptions, you don’t need such a high coverage rate to reap the benefits. At Google there’s a general guideline of 60% as “acceptable”, 75% as “commendable”, and 90% as “exemplary”. My recommendation in these cases is to aim for 80% coverage when possible.
Unrealistic targets
You need to be very careful when setting Code Coverage targets in a software project, especially if they’re tied to some kind of bonus. Unrealistic targets can lead to fake target achievement. An example of an unrealistic target is reaching 80% coverage in six months on a large legacy system with a team that has no prior testing experience.
And how can you hit the target without hitting it? The answer is simple: with fake tests. Below is an example that produces 100% coverage without testing anything.
Fake Code Coverage
Test that produces 100% coverage for the CalcularJurosSimples method without testing anything
public class CalcularJurosSimples(float capitalInicial, float taxaJuros, int tempo)
{
return capitalInicial * (1 + taxaJuros * tempo);
}

[Fact]
public void Deve_calcular_juros_compostos()
{
var montante = CalcularJurosSimples(1000f, 0.1f, 12);

// montante.Should().Be(); // <1>
}- Notice that in this case the test’s assertion wasn’t even implemented. Even without testing anything, since the
CalcularJurosSimples(simple interest) method is invoked during the test, the coverage report will show it as properly covered.
Dica
Unfortunately, this kind of thing happens out there, and it means that reaching a high test coverage percentage doesn’t mean having good tests. This means that reaching a high test coverage percentage doesn’t mean having good tests.
So how do we know if our test suite is any good? To gain confidence and make sure it actually tests what needs to be tested, we can use a counter-metric called Mutation Score, which we’ll look at in the next section.
Mutation Score
Mutation Score is a metric produced by Mutation Testing tools. The goal of Mutation Testing is to measure a test suite’s ability to catch problems in the code. It assumes that a good test suite should be able to catch bugs introduced into the code.
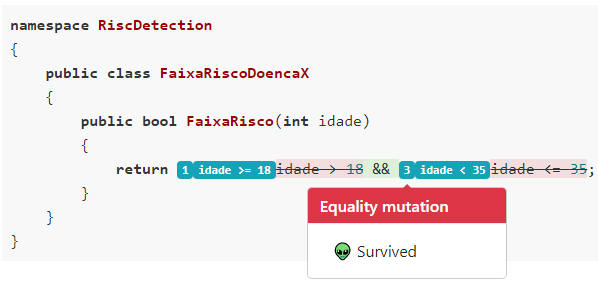
And how do these tools work? They introduce bugs into the application code and run the tests to see whether they catch these mutations. Ideally, for every mutation introduced, at least one test should break. If no test breaks, the test suite has blind spots and needs more tests.
A good Mutation Score combined with a reasonable Coverage Percentage makes an excellent pair of counter-metrics that help us achieve quality in both the code and the tests.
If you want to learn more about mutation testing, check out my other article, where I go into detail on how to introduce mutation testing into .NET projects with the Stryker.NET tool.
Summary
- 100% code coverage makes sense in open-source projects
- 80% code coverage is enough for most commercial projects
- A high test coverage percentage doesn’t guarantee quality
- Mutation Testing can complement Code Coverage to ensure the quality of the test suite and of the application
Podcast
I also had the chance to discuss these topics on AmbevTech Talk.