
How to Debug NuGet Packages with Source Link
What's the most practical way to debug a NuGet package's code? In this article, I show how to use Source Link to build a solid, practical debugging experience.
Source Link is a technology that aims to provide a great debugging experience for .NET binaries and makes developers’ lives much easier when it’s time to fix problems.
To do that, it embeds metadata in binaries and NuGet packages so the IDE can download the source code straight from the repositories on GitHub, GitLab, Azure DevOps, or any other provider that supports the feature.
How to use Source Link to debug libraries
Each IDE has a setting to enable Source Link and allow debugging NuGet packages. Below, I show how to set this up in JetBrains Rider and in Visual Studio.
Setup in Rider or ReSharper
The latest versions of Rider and ReSharper come with everything configured by default, and the experience feels very natural.
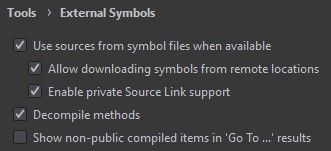
By default, if symbols are available through Source Link, Rider downloads the sources; otherwise, it lets you decompile the binaries, providing a solid fallback strategy.
Setup in Visual Studio:
Visual Studio has supported Source Link since version 2019, but for performance reasons, source downloading is disabled by default.
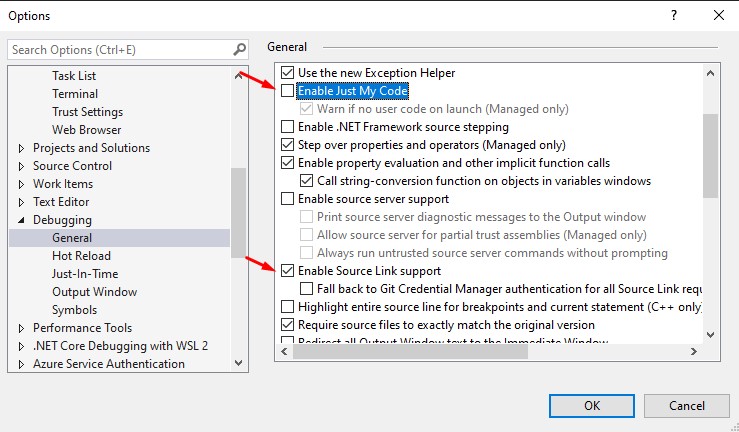
As we can see, we need to:
- Disable the
Enable Just My Codeoption - Enable the
Enable Source Link supportoption, if it isn’t already enabled
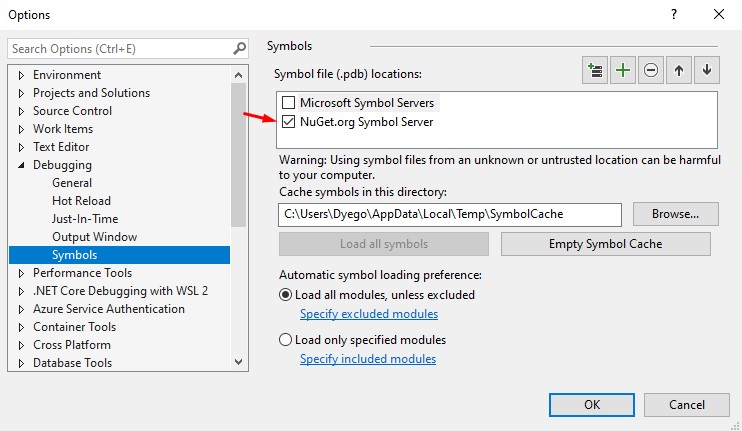
We also need to enable the symbol servers:
Nota
If you also want to debug .NET assemblies, enable the Microsoft Symbol Servers symbol server. Every .NET binary has had Source Link enabled since version 2.1.
Aviso
Visual Studio tends to get quite slow with symbol downloading enabled, so it may be a good idea to turn Enable Just My Code back on once you’re done investigating.
In Rider, this isn’t necessary because there’s no noticeable performance hit.
Debugging a package
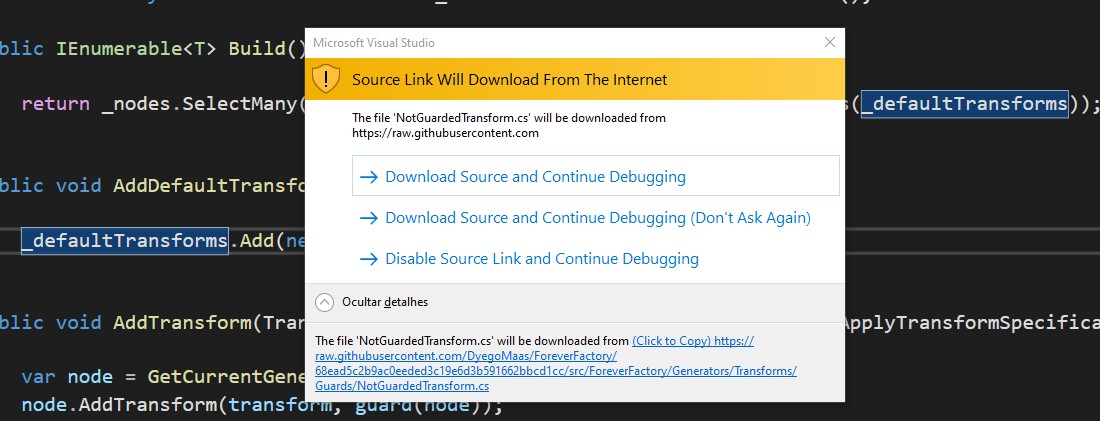
With Source Link enabled, we can debug our code and try a Step Into (F11). As soon as we do, Visual Studio shows the following message:
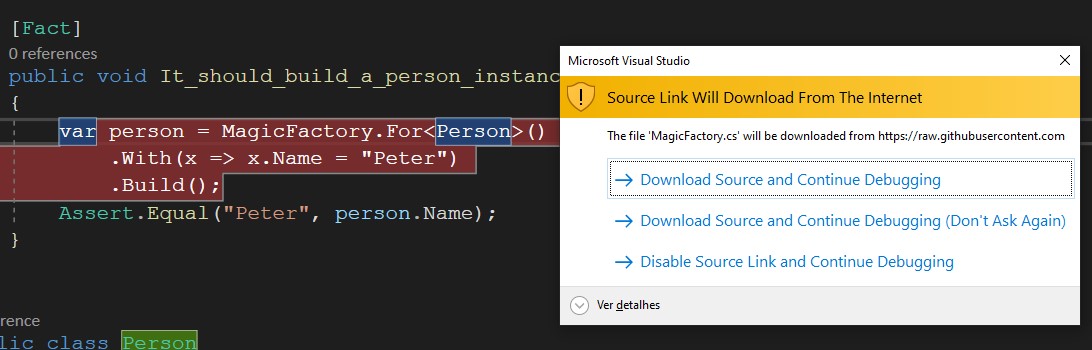
A few details we can notice in the image above:
- The IDE wants to download the source file MagicFactory.cs
- The download source is
https://raw.githubusercontent.com, indicating the package’s source code is hosted on GitHub - We can confirm the download for each new file, or tell Visual Studio to stop asking and always download the sources
Expanding the details, we can see the exact link the source will be downloaded from. Notice that the link includes the hash of the commit (68ead5c2b9ac0eeded3c19e6d3b591662bbcd1cc) that produced the version of the NuGet package we’re trying to debug:
Once the file is downloaded, we can debug the code as usual:
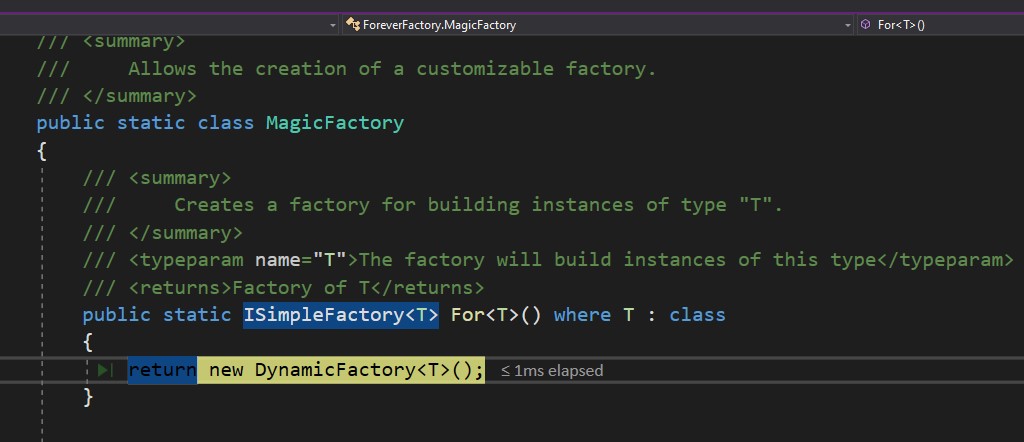
As we can see in the image above, during our debugging session we were able to explore the implementation of a NuGet package by accessing a C# source file that was just downloaded from GitHub.
Where are the sources saved?
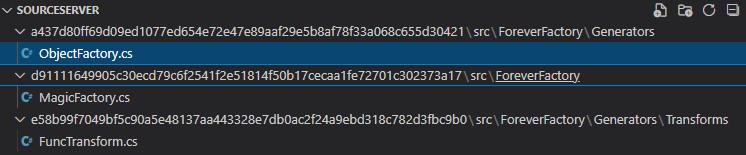
After seeing all of this working, you might be wondering, “but where do these files get saved?”.
~\AppData\Local\SourceServerIf we check that directory, we’ll find each of the downloaded files, each one under the same directory structure it has in its original project:
I hope this article is useful to you!